PBR, PER, ROE are one of important indicators for invest in stocks. When investing in stocks, you often ask yourself, “Is this stock undervalued or overvalued?” To answer this, key financial metrics such as PBR, PER, and ROE are crucial. Understanding these three indicators will enhance your ability to analyze a company’s value and make more informed investment decisions. In this article, we will explore what PBR, PER, and ROE mean and how to use them effectively in stock analysis.
PBR, PER, ROE
1. PBR (Price-to-Book Ratio)
PBR is a metric that compares a company’s stock price to its book value per share (BPS). It indicates how much investors are willing to pay for each dollar of a company’s net assets.
Formula:
PBR = Stock Price / Book Value per Share (BPS)
Example:
If Company A’s stock price is $10 and its BPS is $5, the PBR is 2. This means the market values Company A at twice its book value.
How to Use PBR:
PBR < 1: The stock may be undervalued compared to its net assets.
PBR > 1: The market recognizes the company’s assets as valuable.
Always compare with competitors in the same sector as PBR varies by industry.
2. PER (Price-to-Earnings Ratio)
PER measures the relationship between a company’s stock price and its earnings per share (EPS). It helps assess how much investors are willing to pay for each dollar of earnings.
Formula:
PER = Stock Price / Earnings Per Share (EPS)
Example:
If Company A’s stock price is $10 and its EPS is $1, its PER is 10. This means investors are paying 10 times the company’s annual earnings for its stock.
How to Use PER:
Lower PER (e.g., 5-10): The stock may be undervalued compared to its earnings.
Higher PER (e.g., 30+): Investors expect high future growth.
In high-growth industries, a high PER can still be justified.
3. ROE (Return on Equity)
ROE measures how efficiently a company generates profits from its shareholders’ equity. It indicates how well a company utilizes its capital to generate returns.
Formula:
ROE = (Net Income / Shareholders’ Equity) × 100
Example:
If Company A has a net income of $1 million and shareholder equity of $10 million, its ROE is 10%. This means the company earns a 10% return on its invested capital.
How to Use ROE:
Higher ROE: Indicates efficient use of equity and strong profitability.
Consistently high ROE: Suggests a competitive advantage.
Low or volatile ROE: May signal poor management or financial instability.
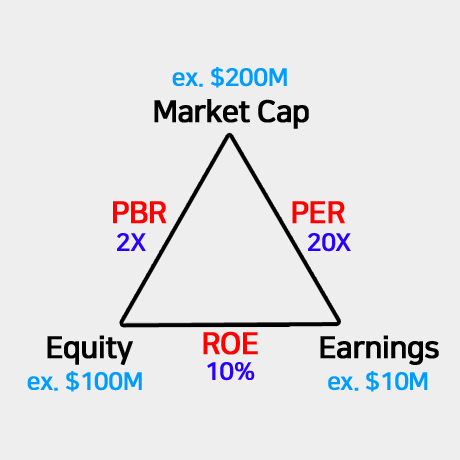
How to Use PBR, PER, ROE Together
These three metrics are most effective when analyzed together rather than separately.
For example:
Low PBR + Low PER + High ROE: The stock may be undervalued despite strong profitability.
High PBR + High PER + Low ROE: The stock could be overvalued by the market.
PBR, PER, ROE
While PBR, PER, and ROE are essential tools for evaluating a stock, they should not be the sole basis for investment decisions. Always compare within the same industry, consider a company’s growth potential, and analyze broader market trends.
Stock investing is not just a numbers game; it’s about understanding a company’s fundamentals. By leveraging PBR, PER, and ROE, you can make well-informed investment choices and enhance your portfolio’s success.